Posted by kerryjones
Are you holding your content marketing to unrealistic standards?
No matter how informative your infographic about tax law may be, it’s not going to attract the same amount of attention as a BuzzFeed Tasty video. You shouldn’t expect it to. In order to determine what successful content looks like for your brand, you first need to have realistic expectations for what content can achieve in your particular niche.
Our analysis of hundreds of Fractl content marketing campaigns looked at the factors which have worked for our content across all topics. Now we've dived a little deeper into this data to develop a better understanding of what to expect from content in different verticals.
What follows is based on data we've collected over the years while working with clients in these industries. Keep in mind these aren’t definitive industry benchmarks – your mileage may vary.

First, we categorized our sample of over 340 Fractl client campaigns into one of 15 different verticals:
- Health and Fitness
- Travel
- Education
- Entertainment
- Drugs and Alcohol
- Politics, Safety, and Crime
- Sex and Relationships
- Business and Finance
- Science
- Technology
- Sports
- Automotive
- Home and Garden
- Pets
- Fashion
We then looked at placements and social media shares for each project. We also analyzed content characteristics like visual asset type and formatting. A “placement” refers to any time a publisher wrote about the campaign. Regarding links, a placement could mean a dofollow, cocitation, nofollow, or text attribution.
Across the entire sample, an average campaign received 90 placements and just over 11,800 social shares. As expected, the results deviated greatly from the average when we looked at the average number of placements and social shares per vertical.

Some verticals, such as Health and Fitness, outperformed the average benchmarks by more than double, with 195 average placements and roughly 62,600 social shares. Not surprisingly, verticals with more niche audiences had lower numbers. For example, Automotive campaigns earned an average of 43 placements and 1,650 social shares.
What were the top-performing topics?
The average campaigns in Health and Fitness, Drugs and Alcohol, and Travel outperformed the average campaigns in other verticals. So what does it take to be successful in each of these three verticals?
Health and Fitness
Our Health and Fitness campaigns were nearly nine times more likely to include side-by-side images than the average vertical.
Many of these side-by-side image campaigns were centered around body image issues. For instance, we Photoshopped women in video games to have body types closer to that of the average American woman. We also used this tactic to highlight male body image issues and differences in beauty standards around the world.
Takeaway: Contrasting images immediately pass along a wealth of information that can be difficult to capture as effectively with standard data visualizations like charts or graphs. Additionally, they carry emotional power.
For instance, we created a morphing GIF of Miss America from 1922 to 2015. The difference between Miss America in 1922 and Miss America in 2015 is stark, and the GIF makes a powerful statement. Readers and publishers were also able to access information about the images that wouldn’t have come across in figures alone (such as the change in clothing styles and the relative lack of diverse contestants).

As part of the project, we also charted the decline in BMI for pageant winners. Depending on the project and available information, it may be helpful to provide some quantitative data to support the narrative told through images.
Interestingly, although Health and Fitness campaigns were 36.4 percent more likely to use social media data than the average vertical, each of the social media campaigns were in the bottom 68 percent of all Health and Fitness campaigns by social shares.
Drugs and Alcohol
Our Drugs and Alcohol campaigns were 2.2 times more likely to use curated data (65 percent versus 30 percent) and 1.4 times more likely to have interactive elements (26 percent versus 19 percent) than the average campaign.
Takeaway: When dealing with emotional and controversial topics like drugs and alcohol, you don’t necessarily need to collect new data to make an impact. Readers and publishers value visualizations that can help explain complex information in simple ways. An additional benefit: creating interactive experiences that allow your audience to explore data on their own and make their own conclusions.
One good example of these principles is our “Pathways to Addiction” campaign, in which we created interactive platforms for exploring data from the National Survey on Drug Use and Health, including information about the sequence in which people have tried different substances.
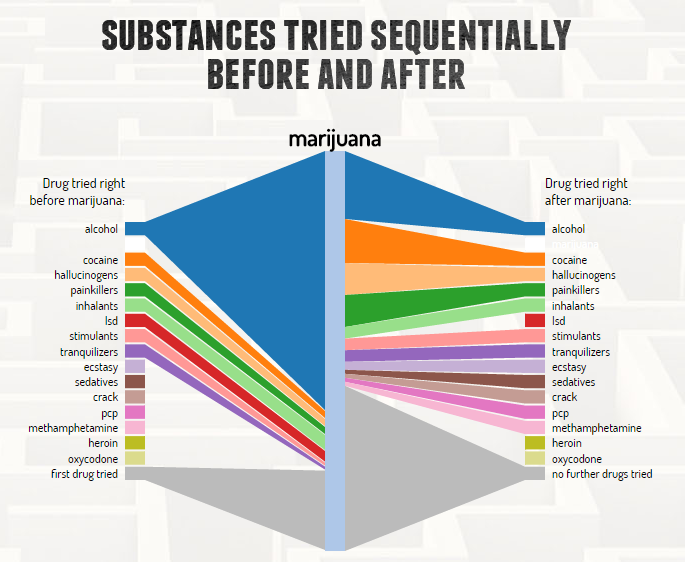
This format allowed readers to explore a controversial topic on their own and draw independent conclusions.
Pro Tip: Whether you choose to use curated data or collect your own data, it is imperative to be impartial in your presentation and open in your methodology when working on campaigns around sensitive or controversial topics. You don’t need to stay away from controversial topics, but you do need to take precautions for your agency and your client.
Travel
Our Travel campaigns were 28.6 percent more likely to use social media data and 30.5 percent more likely to use rankings and comparisons than a campaign in the average vertical.
Takeaway: Travel is an inherently social behavior. For many people, travel isn’t complete until they’ve captured the perfect photo – or five. Travel content that acknowledges this social aspect can be really powerful. Rankings, which also feature heavily in travel content, are strong geographic egobait for readers and publishers and play up the social aspect of the Travel vertical.
Stratos Jet Charters’ Talking Tourists, which combined social media data with rankings, is a great example. For this campaign, we gathered over 37,000 tweets to determine which places were the most and least friendly to tourists.

Talking Tourists was successful (96 placements and over 56,000 social shares) because it used content types with proven success in the travel vertical (social media data, rankings, and maps) to explore a topic that isn’t often explored quantitatively.
How to achieve content marketing success in every vertical
The three industries listed above are ripe for highly successful content, but does that mean less popular verticals should go in with low expectations?
Even with topics that are more difficult to attract the attention of readers and publishers, it is still possible for your content to perform well beyond other content in the vertical. This is particularly true when campaigns align with trending stories or tell a completely unique story.
However, not every piece of content can hit it out of the park. Rand estimates that it will take five to ten attempts to create a piece of successful content. Even then, the average high-performing Science content will not receive the same amount of attention as the average Health and Fitness content.
So how can you maximize the chances for success? Here’s what we’ve observed about our top-performing campaigns in the following verticals:
- Automotive: If you want to create automotive content that appeals to a wider audience, consider using data from social media. Four of our top seven campaigns (by placements) in this vertical featured data from social networks.
- Business and Finance: When it comes to money, people want to know how they stack up. Our top Business and Finance campaigns (by social shares) relied on comparisons or rankings. If you’re looking for social shares, this is the way to go.
- Drugs and Alcohol: Finding interesting correlations or stories in existing datasets can prove popular in this vertical – the majority of top campaigns used curated data.
- Education: Our top Education campaigns featured social media data and interactive features.
- Entertainment: Timely content that connects with a passionate fan base is a recipe for success.
- Fashion: Successful fashion campaigns focused on solving problems for the audience.
- Health and Fitness: Side-by-side images that show a strong contrast perform extremely well in this vertical.
- Home and Garden: To attract attention from readers and publishers in this niche, make your content timely or pop culture-related.
- Pets: The highest-performing campaign in this vertical appealed to readers and publishers because it focused on the social aspects of pet ownership. We also included a geographic egobait component by highlighting distinct regional differences in popular dog breeds.
- Politics, Safety, and Crime: Our top-performing campaign (by social shares) in Politics, Safety, and Crime used social media data to explore a trending topic.
- Science: In this vertical, relating complex topics to pop culture figures, like superheroes, can boost your content’s social appeal. Creating interactive platforms to explore complicated data can also help your audience connect with your campaign.
- Sex and Relationships: Talking about sex and relationships feels a little scandalous, which piques interest. Two of our top three campaigns in this vertical, both by placements and by social shares, used social media data to measure conversation around these topics.
- Sports: This vertical naturally lends itself well to regional egobait. Although only two of our Sports campaigns included maps, these were the most shared of all our sports campaigns.
Browse through the flipbook below to see examples of top-performing campaigns in each vertical.
Try a mixed-vertical strategy
For many of our clients at Fractl, we create content both within and outside of the client’s vertical to maximize reach. Our work with Movoto, a real estate research site, illustrates how one company’s content marketing can span multiple verticals while still remaining highly relevant to the company’s core business.
When developing a content marketing strategy, it is helpful to look at the average placement and social share rate for various verticals. Let’s say a brand that sells decor for log cabins wants to focus 60 percent of its energy on creating highly targeted, niche-specific projects and 40 percent on content designed to raise general awareness about its brand.
Three out of every five campaigns produced for this client should be geared toward publishers who write about log cabins and readers who are on the verge of purchasing log cabin decor. This type of content might include targeted blog posts, industry-specific research, and product comparisons that would appeal to folks at the bottom of the sales funnel.
For the other two campaigns, it’s important to look at adjacent verticals before determining how to move forward. For this particular client, primarily creating Travel content (which yields high average social shares and placements) may be the best course of action.
In addition to the data I’ve shared here, I encourage you to analyze your own content performance data by vertical to set realistic expectations. Vertical-specific metrics can also help identify opportunities to create cross-vertical content for greater traction.
Sign up for The Moz Top 10, a semimonthly mailer updating you on the top ten hottest pieces of SEO news, tips, and rad links uncovered by the Moz team. Think of it as your exclusive digest of stuff you don't have time to hunt down but want to read!
from The Moz Blog http://tracking.feedpress.it/link/9375/4660055 kerryjones
via IFTTT
No comments:
Post a Comment